Probability Distribution
Contents
Probability Distribution#
확률 분포
# 경고 메시지 출력 끄기
import warnings
warnings.filterwarnings(action='ignore')

# 노트북 셀 표시를 브라우저 전체 폭 사용하기
from IPython.core.display import display, HTML
display(HTML("<style>.container { width:100% !important; }</style>"))
from IPython.display import clear_output

%matplotlib inline
import matplotlib.pyplot as plt

import os, sys, shutil, functools
import collections, pathlib, re, string

rseed = 22
import random
random.seed(rseed)

import numpy as np
np.random.seed(rseed)
np.set_printoptions(precision=5)
np.set_printoptions(formatter={'float_kind': "{:.5f}".format})

import pandas as pd
pd.set_option('display.max_rows', None)
pd.set_option('display.max_columns', None)
pd.set_option('display.max_colwidth', None)
pd.options.display.float_format = '{:,.5f}'.format

import scipy as sp

import seaborn as sns

from pydataset import data

print(f"python ver={sys.version}")
print(f"pandas ver={pd.__version__}")
print(f"numpy ver={np.__version__}")
print(f"scipy ver={sp.__version__}")
python ver=3.8.9 (default, Jun 27 2021, 02:41:12)
[GCC 7.5.0]
pandas ver=1.2.5
numpy ver=1.19.5
scipy ver=1.6.3
# Iris 데이터 셋의 컬럼 정보 살피기
df_iris = data('iris')
df_iris.info()
<class 'pandas.core.frame.DataFrame'>
Int64Index: 150 entries, 1 to 150
Data columns (total 5 columns):
 #   Column        Non-Null Count  Dtype
---  ------        --------------  -----
 0   Sepal.Length  150 non-null    float64
 1   Sepal.Width   150 non-null    float64
 2   Petal.Length  150 non-null    float64
 3   Petal.Width   150 non-null    float64
 4   Species       150 non-null    object
dtypes: float64(4), object(1)
memory usage: 7.0+ KB
확률과 확률 분포 (Probability and Probability Distribution)#
주사위를 실제 던져보기 전까지는 주사위의 어떤 수가 나오게 될지 알수 없지만 주사위를 던졌을 때 각 수가 나오는 가능성은 1/6 으로 예측 할 수 있습니다. 추측 통계에서는 결과 예측시 확률과 확률의 분포를 이용합니다.
사상: 시행 (실험, 관측 등)에 의해 생긴 결과 (주사위 예에서는 던져서 나온 수)
확률: 사상이 어느정도 일어나기 쉬운지를 수치화, 모든 사상의 합은 1 (주사위 예에서는 각 눈의 확률)
확률변수: 시행해 봐야 결과를 알 수 있는 변수를 확률 변수라 정의
이산확률변수: 변수가 취할 수 있는 값이 이산형인 확률 변수 (예, 주사위, 동전 등)
연속확률변수: 변수가 취할 수 있는 값이 연속형인 활률 변수 (예, 키, 몸무게 등)
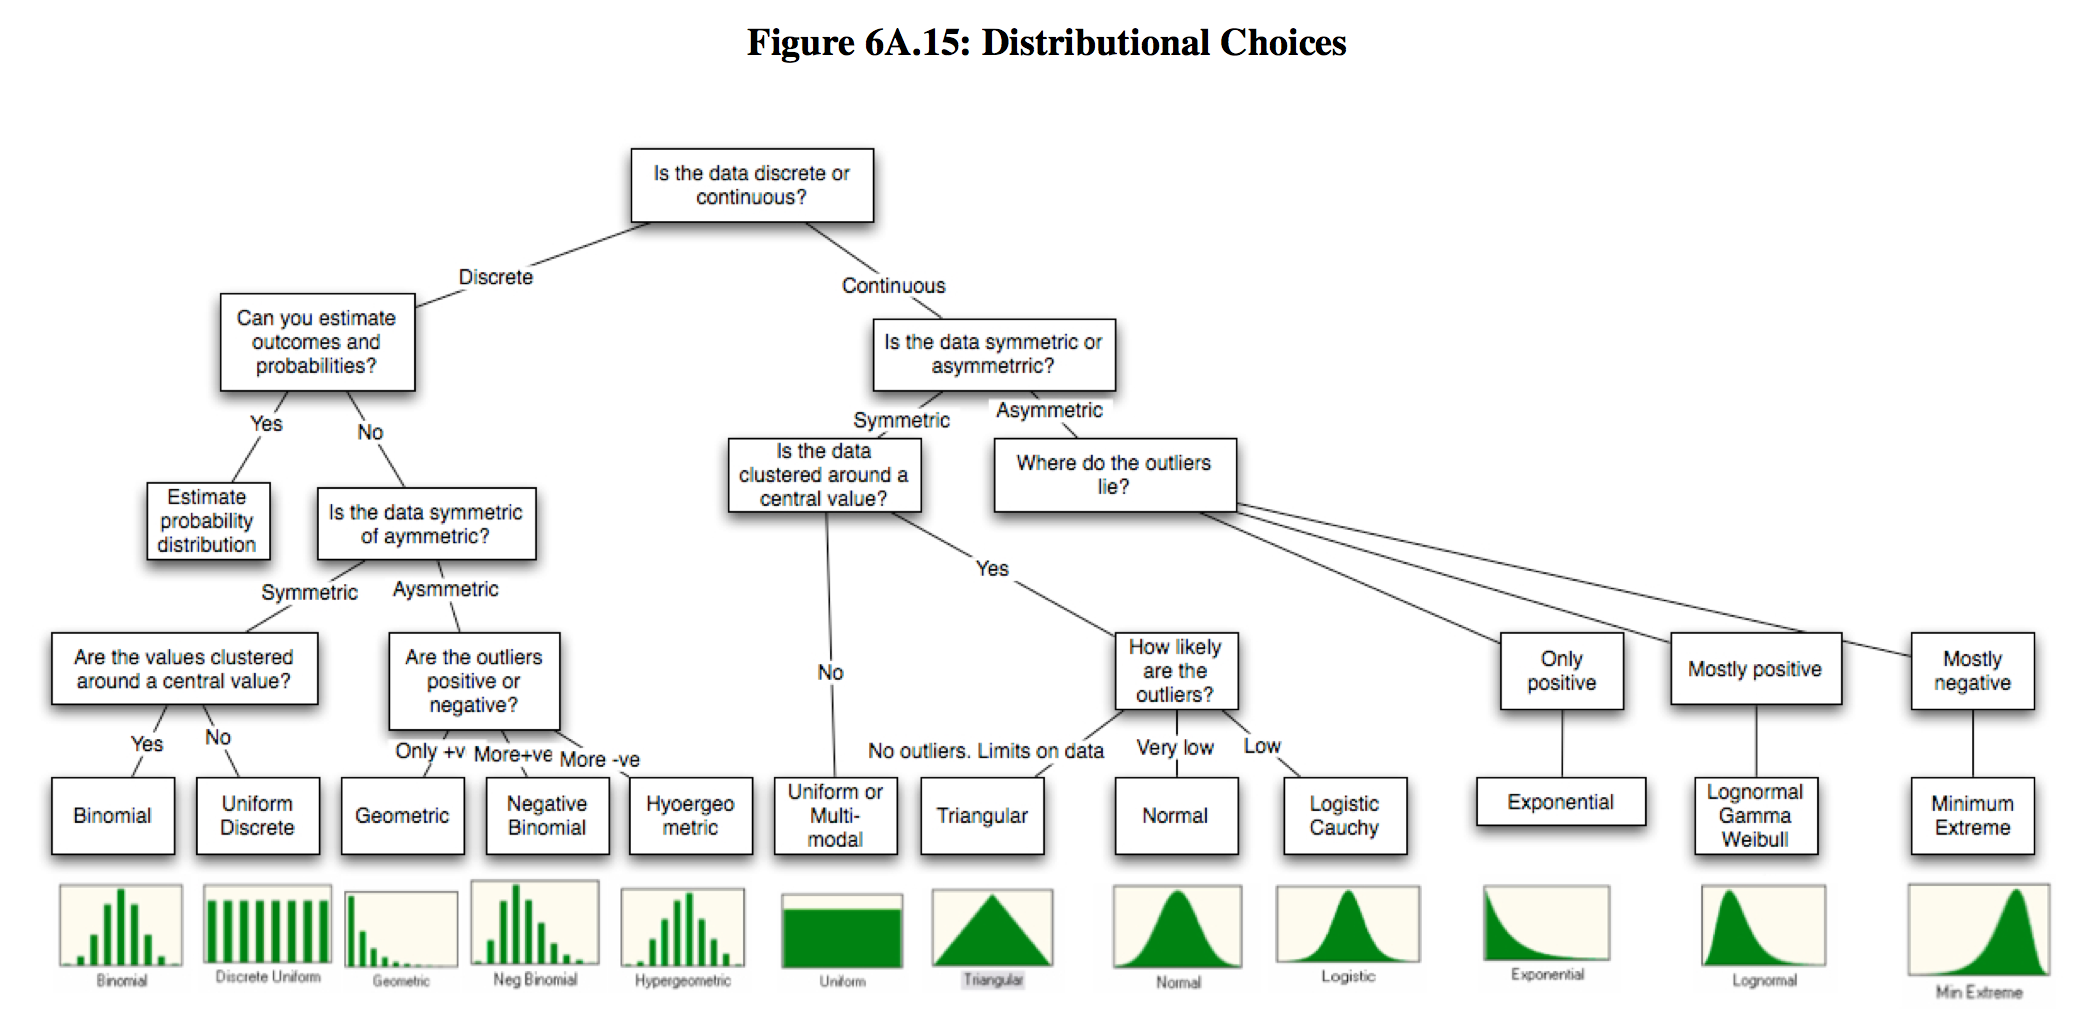
확률분포: 확률 변수(전체 합 = 1)가 취할 수 있는 값이 어떻게 분포하고 있는지 나타냄
https://tinyheero.github.io/2016/03/17/prob-distr.html
Further Reading
도수분포표 (Frequency Distribution Table)
도수분포표는 데이터를 계급으로 나누고 계급에 대한 빈도를 세어 표시하는 테이블입니다. 범주형 변수의 경우는 간단하게 구할 수 있지만, 연속형 변수의 경우에는 어떻게 계급을 나누어 표시해야 하는지에 대한 어려운 부분이 존재합니다.
연속형 변수의 적장한 계급 수를 구하는 방법은 주로 Sturge’s rule 또는 Freedman-Diaconis rule 을 사용합니다.
Sturge’s rule

Freedman-Diaconis rule

df_iris = data('iris')

# 범주형 변수의 도수 분포표
fdt = pd.crosstab(index=df_iris['Species'], columns='frequency')
fdt['cumulative_frequency'] = fdt['frequency'].cumsum() # 누적도수
fdt['relative_frequency'] = fdt['frequency'] / fdt['frequency'].sum() # 상대도수
fdt
| col_0 | frequency | cumulative_frequency | relative_frequency |
|---|---|---|---|
| Species | |||
| setosa | 50 | 50 | 0.33333 |
| versicolor | 50 | 100 | 0.33333 |
| virginica | 50 | 150 | 0.33333 |
# 연속형 변수의 도수 분포표
# Sturges's Rule 에 따른 Binning
n_data = df_iris['Sepal.Length'].count()
n_bins = int(np.ceil(np.log2(n_data) + 1))
bins = pd.cut(x=df_iris['Sepal.Length'], bins=n_bins, right=False)
fdt = pd.crosstab(index=bins, columns='frequency')
fdt['cumulative_frequency'] = fdt['frequency'].cumsum() # 누적도수
fdt['relative_frequency'] = fdt['frequency'] / fdt['frequency'].sum() # 상대도수
fdt['cumulative_relative_frequency'] = fdt['relative_frequency'].cumsum() # 누적상대도수
fdt
| col_0 | frequency | cumulative_frequency | relative_frequency | cumulative_relative_frequency |
|---|---|---|---|---|
| Sepal.Length | ||||
| [4.3, 4.7) | 9 | 9 | 0.06000 | 0.06000 |
| [4.7, 5.1) | 23 | 32 | 0.15333 | 0.21333 |
| [5.1, 5.5) | 20 | 52 | 0.13333 | 0.34667 |
| [5.5, 5.9) | 28 | 80 | 0.18667 | 0.53333 |
| [5.9, 6.3) | 28 | 108 | 0.18667 | 0.72000 |
| [6.3, 6.7) | 14 | 122 | 0.09333 | 0.81333 |
| [6.7, 7.1) | 17 | 139 | 0.11333 | 0.92667 |
| [7.1, 7.5) | 5 | 144 | 0.03333 | 0.96000 |
| [7.5, 7.904) | 6 | 150 | 0.04000 | 1.00000 |
히스토그램 (Histogram)
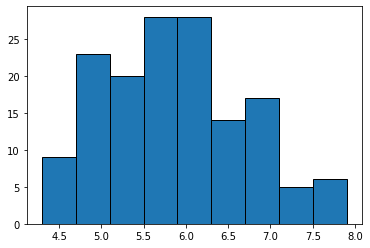
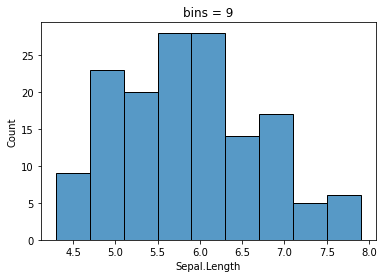
도수분포표를 통해 구한 계급 구간을 이용하여 히스토그램으로 데이터를 시각화 하여 살펴 봅니다. 히스토그램을 통한 데이터 시각화를 하면 좀 더 데이터 분포에 대하여 직관적으로 살펴볼 수 있습니다.
# Pandas를 이용한 시각화
df_iris['Sepal.Length'].hist(bins=n_bins, grid=False, edgecolor='black')
<AxesSubplot:>
# Seaborn을 이용한 시각화
sns.histplot(x=df_iris['Sepal.Length'],bins=n_bins)
plt.title(f'bins = {n_bins}')
Text(0.5, 1.0, 'bins = 9')
이산확률분포#
확률변수가 취할 수 있는 값이 이산적인 확률변수
확률질량함수(Probability mass function)
확률변수 X 가 취할 수 있는 값에 대한 집합 \(X = {x_1, x_2, x_3, ...}\) 일때, 확률변수 X가 \(x_k\)를 취할 확률
누적분포함수(Cumulative distribution function)
확률변수 X가 x이하가 될 때의 확률
기대값(Expted value)
확률변수의 평균
분산(Variance)
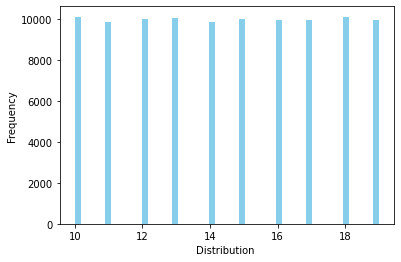
이산균등분포 (Discrete Uniform Distribution)#
사상이 일어나는 확률이 같은 분포, 확률변수가 x = {1, …, n} 1,2,3, .. 값은 이산 값을 취할때,
확률질량함수
베르누이 분포에서 1이 나오는 확률을 p 라고 할때,
기대값과 분산

https://www.researchgate.net/figure/Uniform-Distribution-Types_fig3_319013233
Further Reading
rv = sp.stats.randint(low=10, high=20)
rvs = rv.rvs(size=100000)
ax = sns.distplot(rvs, bins=50, kde=False,
                  color='skyblue', hist_kws={"linewidth": 15,'alpha':1})
ax.set(xlabel='Distribution ', ylabel='Frequency')
[Text(0.5, 0, 'Distribution '), Text(0, 0.5, 'Frequency')]
베르누이분포#
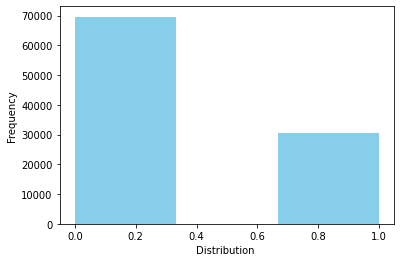
확률변수가 취할 수 있는 값이 0/1 밖에 없는 분포, 가장 기본적인 이산형 확률분포
확률질량함수
베르누이 분포에서 1이 나오는 확률을 p 라고 할때,
기대값과 분산
p = 0.3
rv = sp.stats.bernoulli(p)
print(f"f(0)={rv.pmf(0):.3f}, f(1)={rv.pmf(1):.3f}")
print(f"F(0)={rv.cdf(0):.3f}, F(1)={rv.cdf(1):.3f}")
print(f"E(X)={rv.mean():.3f}, V(X)={rv.var():.3f}")

rvs = rv.rvs(size=100000)
ax = sns.distplot(rvs, bins=3, kde=False,
                  color='skyblue', hist_kws={"linewidth": 15,'alpha':1})
ax.set(xlabel='Distribution ', ylabel='Frequency')
f(0)=0.700, f(1)=0.300
F(0)=0.700, F(1)=1.000
E(X)=0.300, V(X)=0.210
[Text(0.5, 0, 'Distribution '), Text(0, 0.5, 'Frequency')]
이항분포 (Binomial Distribution)#
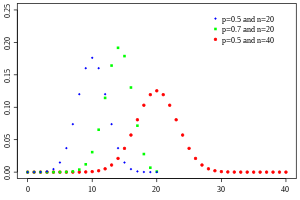
성공확률이 p인 베르누이 시행을 n번 했을 때의 성공 횟수가 따르는 분포
확률질량함수
연속된 n번의 독립적 시행에서 각 시행이 성공 확률 p를 가질 때,
기대값과 분산
https://en.wikipedia.org/wiki/Binomial_distribution
Further Reading
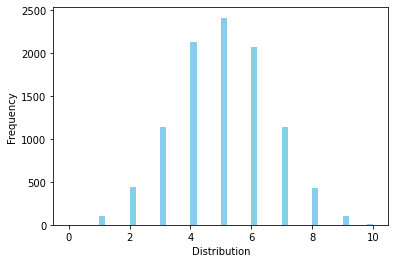
# 성공확률이 0.5인 동전던지기에서 10번 수행시 성공확률
n = 10
p = 0.5
rv = sp.stats.binom(n=n,p=p)
print(f"f(1)={rv.pmf(1):.3f}, f(8)={rv.pmf(8):.3f}")
print(f"F(1)={rv.cdf(1):.3f}, F(8)={rv.cdf(8):.3f}")
print(f"E(X)={rv.mean():.3f}, V(X)={rv.var():.3f}")

rvs = rv.rvs(size=10000)
ax = sns.distplot(rvs, kde=False,
                  color='skyblue', hist_kws={"linewidth": 15,'alpha':1})
ax.set(xlabel='Distribution', ylabel='Frequency')
f(1)=0.010, f(8)=0.044
F(1)=0.011, F(8)=0.989
E(X)=5.000, V(X)=2.500
[Text(0.5, 0, 'Distribution'), Text(0, 0.5, 'Frequency')]
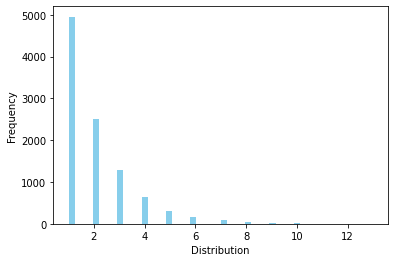
기하분포 (Geometric Distribution)#
베르누이 시행에서 처음 성공할때까지 반복한 시행 횟수가 따르는 분포
확률질량함수
성공 확률이 p이고, 확률변수의 값이 1 이상인 정수일때(기하분포는 첫성공 후, 연속 실패 가능성이 있기 때문),
기대값과 분산

https://en.wikipedia.org/wiki/Geometric_distribution
Further Reading
# 성공확률이 0.5인 동전던지기에서 x번 시행시 성공할 확률
p = 0.5
rv = sp.stats.geom(p=p)
print(f"f(1)={rv.pmf(1):.3f}, f(8)={rv.pmf(8):.3f}")
print(f"F(1)={rv.cdf(1):.3f}, F(8)={rv.cdf(8):.3f}")
print(f"E(X)={rv.mean():.3f}, V(X)={rv.var():.3f}")

rvs = rv.rvs(size=10000)
ax = sns.distplot(rvs, kde=False,
                  color='skyblue', hist_kws={"linewidth": 15,'alpha':1})
ax.set(xlabel='Distribution', ylabel='Frequency')
f(1)=0.500, f(8)=0.004
F(1)=0.500, F(8)=0.996
E(X)=2.000, V(X)=2.000
[Text(0.5, 0, 'Distribution'), Text(0, 0.5, 'Frequency')]
포아송 분포 (Poisson Distribution)#
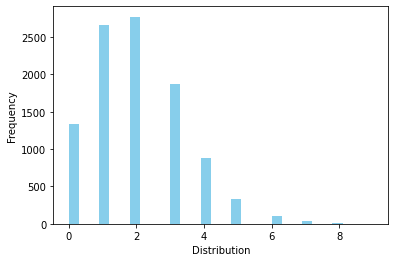
시행 횟수가 많고, 사상 발생의 확률은 아주 작은 이항분포, 단위 시간 또는 단위 공간 안에 어떤 사건이 몇 번 발생할 것인지를 표현하는 이산 확률 분포
확률질량함수
정해진 시간 안에 어떤 사건이 일어날 횟수에 대한 기댓값이 \(\lambda = np\) 일때, 그 사건이 x 회 일어날 확률
기대값과 분산
\(\lambda\) 값이 커질 수록 정규분포에 가까워짐
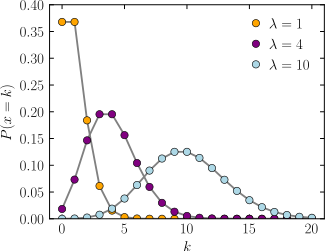
https://en.wikipedia.org/wiki/Poisson_distribution
Further Reading
# 평균 불량율이 2인 제품 생산시 불량이 1개(x = 1)발생할 확률
p = 0.002
n = 1000
l = n*p
rv = sp.stats.poisson(l)

print(f"f(1)={rv.pmf(1):.3f}, f(8)={rv.pmf(8):.3f}")
print(f"F(1)={rv.cdf(1):.3f}, F(8)={rv.cdf(8):.3f}")
print(f"E(X)={rv.mean():.3f}, V(X)={rv.var():.3f}")

# 포아송분포에서 실제 10000개 랜덤 샘플링 후 시각화
rvs = rv.rvs(size=10000)
ax = sns.distplot(rvs, bins=30, kde=False,
                  color='skyblue', hist_kws={"linewidth": 15,'alpha':1})
ax.set(xlabel='Distribution', ylabel='Frequency')
f(1)=0.271, f(8)=0.001
F(1)=0.406, F(8)=1.000
E(X)=2.000, V(X)=2.000
[Text(0.5, 0, 'Distribution'), Text(0, 0.5, 'Frequency')]
연속확률분포#
확률변수가 취할 수 있는 값이 연속적인 확률변수
확률밀도함수(Probability density function)
확률변수 X 가 취할 수 있는 값에 대한 집합 \(X = {x_1, x_2, x_3, ...}\) 일때, 확률변수 X가 \(x_k\)를 취할 확률
누적분포함수(Cumulative distribution function)
확률변수 X가 x이하가 될 때의 확률
기대값(Expted value)
확률변수의 평균
분산(Variance)
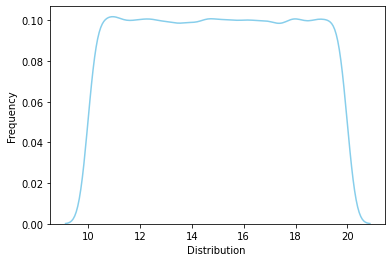
연속균등분포 (Continuous Uniform Distribution)#
사상이 일어나는 확률이 같은 분포, 확률변수가 x = \([\alpha, \beta]\) 사이에 연속적인 값을 취할때,
확률밀도함수
기대값과 분산

https://www.researchgate.net/figure/Uniform-Distribution-Types_fig3_319013233
Further Reading
rv = sp.stats.uniform(loc=10, scale=10)
rvs = rv.rvs(size=100000)
ax = sns.distplot(rvs, bins=100, kde=True, hist=False,
                  color='skyblue', hist_kws={"linewidth": 15,'alpha':1})
ax.set(xlabel='Distribution ', ylabel='Frequency')
[Text(0.5, 0, 'Distribution '), Text(0, 0.5, 'Frequency')]
정규분포 (Normal Distribution)#
평균값을 중심으로 대칭을 이루는 종 모양의 분포, 자연에서 일어나는 많은 수의 데이터들이 정규분포를 따르는 경우가 많기 때문에 통계학에서 가장 중요하게 다루는 분포입니다.
확률밀도함수
기대값과 분산
표준정규분포(Z Distribution)
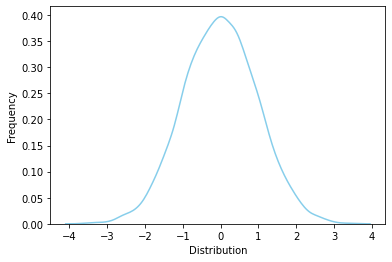
표준졍규분포는 데이터의 평균값을 0으로 표준편차를 1로 변환하여 데이터의 척도에 상관 없이 사용할 수 있도록 표준화한 분포입니다.
표준화변량 (Z-Score)
표준화변량(Z-score)를 이용하면 평균과 표준편차가 다른 두 집단에 속한 데이터가 표준 정규 분포 상의 어느 확률 지점에 존재하는지 같은 기준을 통해 비교해 볼수 있게 됩니다. 예를 들면, 사내 어학연수 선발에서 토익성적만 있는 지원자와 토플성적만 있는 지원자 중 선발이 필요할 경우 직접적 비교가 어렵지만, 두 지원자의 점수를 Z-score로 표준화하여 같은 분포상에서 비교한다면 선발이 가능하게 됩니다.

https://mathbitsnotebook.com/Algebra2/Statistics/STzScores.html
왜도와 첨도(Skew & Kurtosis)
표준분포의 모양이 정규분포에서 어느정도 벗어나는지를 측정하기 위한 지표
왜도 (Skew)
첨조 (Kurtosis)

# Scipy 를 이용한 각 변수의 Z-score 계산
#sp.stats.zscore(df_iris['Sepal.Length'])

# Pandas에서 apply()에 zscore()를 전달하여 계산
df_zscore = df_iris.drop('Species', axis=1).apply(sp.stats.zscore)
display(df_zscore.head())

# Pandas에서 Skew / Kurtosis 계산
display(df_iris.skew())
display(df_iris.kurtosis())
| Sepal.Length | Sepal.Width | Petal.Length | Petal.Width | |
|---|---|---|---|---|
| 1 | -0.90068 | 1.01900 | -1.34023 | -1.31544 |
| 2 | -1.14302 | -0.13198 | -1.34023 | -1.31544 |
| 3 | -1.38535 | 0.32841 | -1.39706 | -1.31544 |
| 4 | -1.50652 | 0.09822 | -1.28339 | -1.31544 |
| 5 | -1.02185 | 1.24920 | -1.34023 | -1.31544 |
Sepal.Length    0.31491
Sepal.Width     0.31897
Petal.Length   -0.27488
Petal.Width    -0.10297
dtype: float64
Sepal.Length   -0.55206
Sepal.Width     0.22825
Petal.Length   -1.40210
Petal.Width    -1.34060
dtype: float64
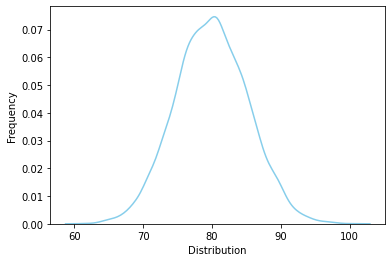
# 시험점수가 N(80, 5.2)(평균:80, 표준편차:5.2)인 정규분포에서 82점일 확률
mu = 80
std = 5.2
# scipy 의 statistics 패키지를 이용하여 정규분포에서 원하는 값 계산
# https://docs.scipy.org/doc/scipy/tutorial/stats.html
rv = sp.stats.norm(loc=mu, scale=std)

# 확률밀도함수(Probability density function)
print(f"f(82)={rv.pdf(82.0):.3f}")
# 누적분포함수(Cumulative distribution function): P(X <= 82): 82점 이하일 확률
print(f"F(82)={rv.cdf(82.0):.3f}")
# Survival Function (1-CDF): P(X >= 82): 82점 이상일 확률
print(f"1 - F(82)={rv.sf(82.0):.3f}")
# 기대값(Expted value), 분산 (Variance)
print(f"E(X)={rv.mean():.3f}, V(X)={rv.var():.3f}")

# 상위 % 를 가지는 값 구하기
# Percent Point Function (Inverse of CDF): P(X <= x) = 90% 일때, x의 값
print(f"Top 10% point with ppf: {rv.ppf(0.90):.3f}")
# Inverse Survival Function (Inverse of SF): P(X >= x) = 10% 일때, x의 값
print(f"Top 10% point with isf: {rv.isf(0.10):.3f}")
# 중위 90% 확률을 가지는 구간
print(f"중위 90% interval: {rv.interval(0.9)[0]:.3f} < x < {rv.interval(0.9)[1]:.3f}")
# 상위 5%, 하위 5% 점수 구간
print(f"상하위 5% interval with ppf: x < {rv.ppf(0.05):.3f}, {rv.ppf(0.95):.3f} < x")
print(f"상하위 5% interval with isf: x < {rv.isf(0.95):.3f}, {rv.isf(0.05):.3f} < x")

rvs = rv.rvs(size=10000)
ax = sns.distplot(rvs, bins=100, kde=True, hist=False,
                  color='skyblue', hist_kws={"linewidth": 15,'alpha':1})
ax.set(xlabel='Distribution', ylabel='Frequency')
f(82)=0.071
F(82)=0.650
1 - F(82)=0.350
E(X)=80.000, V(X)=27.040
Top 10% point with ppf: 86.664
Top 10% point with isf: 86.664
중위 90% interval: 71.447 < x < 88.553
상하위 5% interval with ppf: x < 71.447, 88.553 < x
상하위 5% interval with isf: x < 71.447, 88.553 < x
[Text(0.5, 0, 'Distribution'), Text(0, 0.5, 'Frequency')]
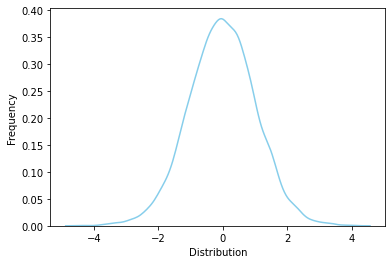
# 표준정규분포 (Z-distribution) N(0,1)
rv = sp.stats.norm(loc=0, scale=1)
rvs = rv.rvs(size=10000)
ax = sns.distplot(rvs, bins=100, kde=True, hist=False,
                  color='skyblue', hist_kws={"linewidth": 15,'alpha':1})
ax.set(xlabel='Distribution', ylabel='Frequency')
[Text(0.5, 0, 'Distribution'), Text(0, 0.5, 'Frequency')]
Q-Q Plot (Quantile-Quantile Plot)
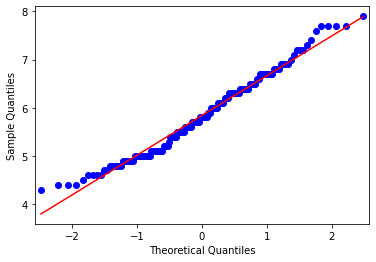
정규분포인지를 살펴보기 위한 다른 시각화 방식은 Q-Q Plot 입니다. Q-Q Plot 은 정규분포와 실제 데이터의 같은 Quantile 상의 데이터를 샘플링해 point를 찍어 봄으로써 두 분포가 유사한지를 시각화하여 판단하는 방식입니다. point 들이 직선을 이룬다면 두 분포는 같은 정규분포일 가능성이 높습니다.
from statsmodels.graphics.gofplots import qqplot

# q-q plot
qqplot(df_iris['Sepal.Length'], line='s')
plt.show()
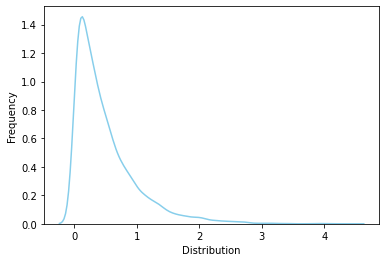
지수분포 (Exponential Distribution)#
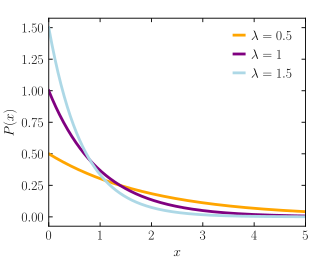
어떤 사건이 발생하는 간격(시간)이 따르는 분포
확률밀도함수
단위 시간당 평균 \(\lambda\)번 발생하는 사건의 발생 간격을 따를 때,
기대값과 분산
https://en.wikipedia.org/wiki/Exponential_distribution
Further Reading
# 한달 평균 2건의 교통사고가 발생하는 지역에서 한달 교통사고 발생 간격
l = 2
rv = sp.stats.expon(scale=1.0/l)

print(f"f(1)={rv.pdf(1):.3f}, f(3)={rv.pdf(3):.3f}")
# 1달안에 교통사고가 발생할 확률, 3달안에 교통사고가 발생할 확률
print(f"F(1)={rv.cdf(1):.3f}, F(3)={rv.cdf(3):.3f}")
print(f"E(X)={rv.mean():.3f}, V(X)={rv.var():.3f}")

# 랜덤 샘플링 후 시각화
rvs = rv.rvs(size=10000)
ax = sns.distplot(rvs, bins=30, kde=True, hist=False,
                  color='skyblue', hist_kws={"linewidth": 15,'alpha':1})
ax.set(xlabel='Distribution', ylabel='Frequency')
f(1)=0.271, f(3)=0.005
F(1)=0.865, F(3)=0.998
E(X)=0.500, V(X)=0.250
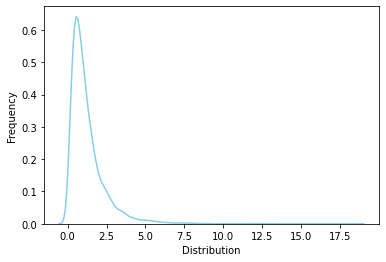
[Text(0.5, 0, 'Distribution'), Text(0, 0.5, 'Frequency')]
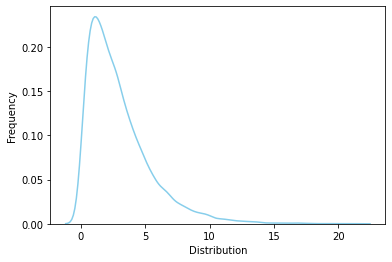
카이제곱 분포 (Chi-squared(\(x^2\)) Distribution)#
추정과 검정에 사용되는 특수한 확률분포 중 하나, 분산의 구간 추정이나 독립성 검정에 사용

https://ko.wikipedia.org/wiki/카이제곱_분포
Further Reading
# Chi-squared distribution degree of freedom = 3
rv = sp.stats.chi2(df=3)

rvs = rv.rvs(size=10000)
ax = sns.distplot(rvs, bins=100, kde=True, hist=False,
                  color='skyblue', hist_kws={"linewidth": 15,'alpha':1})
ax.set(xlabel='Distribution', ylabel='Frequency')
[Text(0.5, 0, 'Distribution'), Text(0, 0.5, 'Frequency')]
T 분포 (T Distribution)#
추정과 검정에 사용되는 특수한 확률분포 중 하나, 모분산을 알 수 없고, 표본 크기가 작을 때 정규분포 Z값 대신 T 분포의 T값을 이용해 추정 또는 검정에 사용
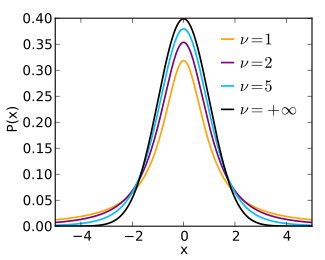
https://en.wikipedia.org/wiki/Student’s_t-distribution
Further Reading
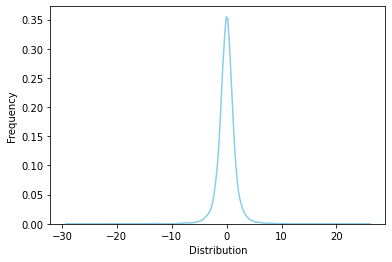
# T-distribution degree of freedom = 3
rv = sp.stats.t(df=3)

rvs = rv.rvs(size=10000)
ax = sns.distplot(rvs, bins=100, kde=True, hist=False,
                  color='skyblue', hist_kws={"linewidth": 15,'alpha':1})
ax.set(xlabel='Distribution', ylabel='Frequency')
[Text(0.5, 0, 'Distribution'), Text(0, 0.5, 'Frequency')]
# T-distribution degree of freedom = 30, 정규분포와 가까워짐
rv = sp.stats.t(df=30)

rvs = rv.rvs(size=10000)
ax = sns.distplot(rvs, bins=100, kde=True, hist=False,
                  color='skyblue', hist_kws={"linewidth": 15,'alpha':1})
ax.set(xlabel='Distribution', ylabel='Frequency')
[Text(0.5, 0, 'Distribution'), Text(0, 0.5, 'Frequency')]
F 분포 (F Distribution)#
분산분석 등에서 사용되는 확률 분포
확률변수 \(Y_1\), \(Y_2\)는 서로 독립이고, 각 카이제곱분포를 따를 때(\(Y_1 \sim x^2(n_1)\), \(Y_2 \sim x^2(n_2)\)),
의 확률분포를 자유도가 \(n_1\), \(n_2\)인 F분포 \(F(n_1, n_2)\)
rv = sp.stats.f(5, 10)

rvs = rv.rvs(size=10000)
ax = sns.distplot(rvs, bins=100, kde=True, hist=False,
                  color='skyblue', hist_kws={"linewidth": 15,'alpha':1})
ax.set(xlabel='Distribution', ylabel='Frequency')
[Text(0.5, 0, 'Distribution'), Text(0, 0.5, 'Frequency')]
